Contact Fidelity Investments Customer Service
Email Support directly
Chat with our AppContacter AI Support
Why should I report an Issue with Fidelity Investments?
- AppContacter will directly Email your issue/feedback to an apps's customer service once you report an issue and with lots of issues reported, companies will definitely listen to you.
- Pulling issues faced by users like you is a good way to draw attention of Fidelity Investments to your problem using the strength of crowds.
- Importantly, customers can learn from other customers in case the issue is a common problem that has been solved before.

|
About Fidelity Investments
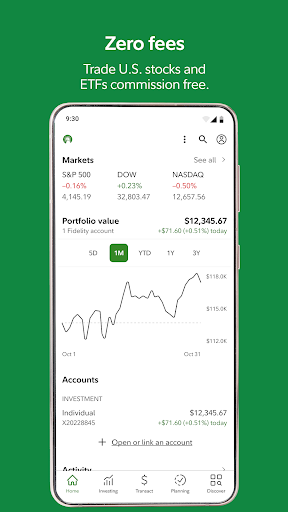
1. All-in-one app: Deposit checks, pay bills, track spending, trade stocks, and more, all backed by 75 years of Fidelity’s financial expertise. • Trade stocks, ETFs, and mutual funds using industry-leading research and market analysis. • Trade smarter with advanced charts and on-the-go technical analysis. • Monitor markets and trading with real-time quotes. • Trade, transfer, deposit checks, and pay bills. • Build your confidence in investing with podcasts, articles, videos, and more. • From small classes and coaching sessions to large multi-session webinars, we have something to help you take your knowledge to the next level. • Receive timely, customizable alerts to help you manage your stock trading.
2. Secure: Fidelity is committed to your security with 2-factor authentication, voice biometrics, security text alerts, and money transfer lockdowns.
3. Fidelity’s secure and easy-to-use award-winning app gives you access to a broad choice of investments, expert insights, and investing tools—helping you make smart decisions with your money.
4. Set price triggers so you never miss an entry or exit on your investments. • Get state-of-the-art security in 2-factor authentication and voice biometrics.
5. Easy: Get started with no account fees or minimums when you open a retail brokerage account.
6. Plus, get commission-free trades for US stocks, ETFs, and fractional shares for as little as $1.
7. Looking to manage your workplace benefits like a 401(k) or HSA?
8. Invest at a firm invested in you.
9. Download our NetBenefits® app in the “More by Fidelity Investments” section below.
Fidelity Investments Customer Insights
1. It shows your line graph progress correctly, but when you switch, for example, 1 year to YTD, it does not show the amount of change or percentage of change.With latest app updates, UX design team ruined the UI with too many fixed components on screen.
2. While the app may be intuitive or not, it's hard to know since everything looks the same and what you're looking for doesn't stand out in any way.The most recent update has a simple error in showing your (1 month, YTD, 1 year, etc) information on all your various accounts.
3. Fidelity has above average communication, but it's the 'no-fee trades' policy that puts them at the top of the heap.5/19 - lost advanced watchlist Old- the user experience using the website/app is very basic.
4. Fix these basic things before trying to implement new features.UPDATE WARNING!! SMH change to the 'list' tab.
5. It does not show aftermarket moves in percentages, does not show a personal rate of return, the charts display in the app is very very basic and hard to use.
6. Fidelity's institutional soundness should combine with Robinhood's UXTerrible performance from an app that's important to provide information when I want it.
7. The usable real estate on screen is hardly 40% in portrait mode and in landscape mode the scrollable area is less than 10% of the entire screen.
8. First the chart was removed from the quick view screen, now the all-accounts total is removed too.
9. I have to track price and profit/loss in Yahoo because often an individual stock in my portfolio cannot be provided in the Fidelity app.
10. It now shows share fluctuation instead of price per share; each individual stock must be chosen to see its price.
11. There's way too much on the screen at a given time, and it's rarely information I'm interested in.
Steps to Troubleshoot & Fix Fidelity Investments Issues
1. Fix Fidelity Investments Not Working/Crashes/Errors/Unresponsive & Black/White screen:
- Restart Fidelity Investments: Restarting the app will resolve most errors.
- Update the Fidelity Investments App. Here is how:
- On Android goto PlayStore » Search for "Fidelity Investments" » Open Fidelity Investments » click "Update".
- On iPhone, goto AppStore » Your profile » Available Updates » Check for Fidelity Investments » click "UPDATE".
- Clear Fidelity Investments app cache: Clearing cached data will force your app to retrieve the latest data directly from Fidelity Investments servers.
- On Android, goto Settings » Apps » Select "Fidelity Investments" » click Storage » click "Clear Cache".
- Check Fidelity Investments app permissions. If any of these permissions required to use your device's features are disenabled, Fidelity Investments might not work.
- Uninstall and reinstall Fidelity Investments. If nothing else has worked, completely uninstall Fidelity Investments then reinstall.
- Restart your device. Last, restarting your device can often clear most problems causing Fidelity Investments not working
2. Fix Fidelity Investments Server issues & Internet Connection
- Check network connection: An unstable Internet will make Fidelity Investments be unable to connect to it's servers. Ensure your wi-fi is working then restart app.
- Disable VPN: VPN can cause connection errors and lead to Fidelity Investments not working. Make sure all VPNs are off
- Enable background data: When Background data is turned off, Fidelity Investments may not be able to connect to the Internet when running in the background.